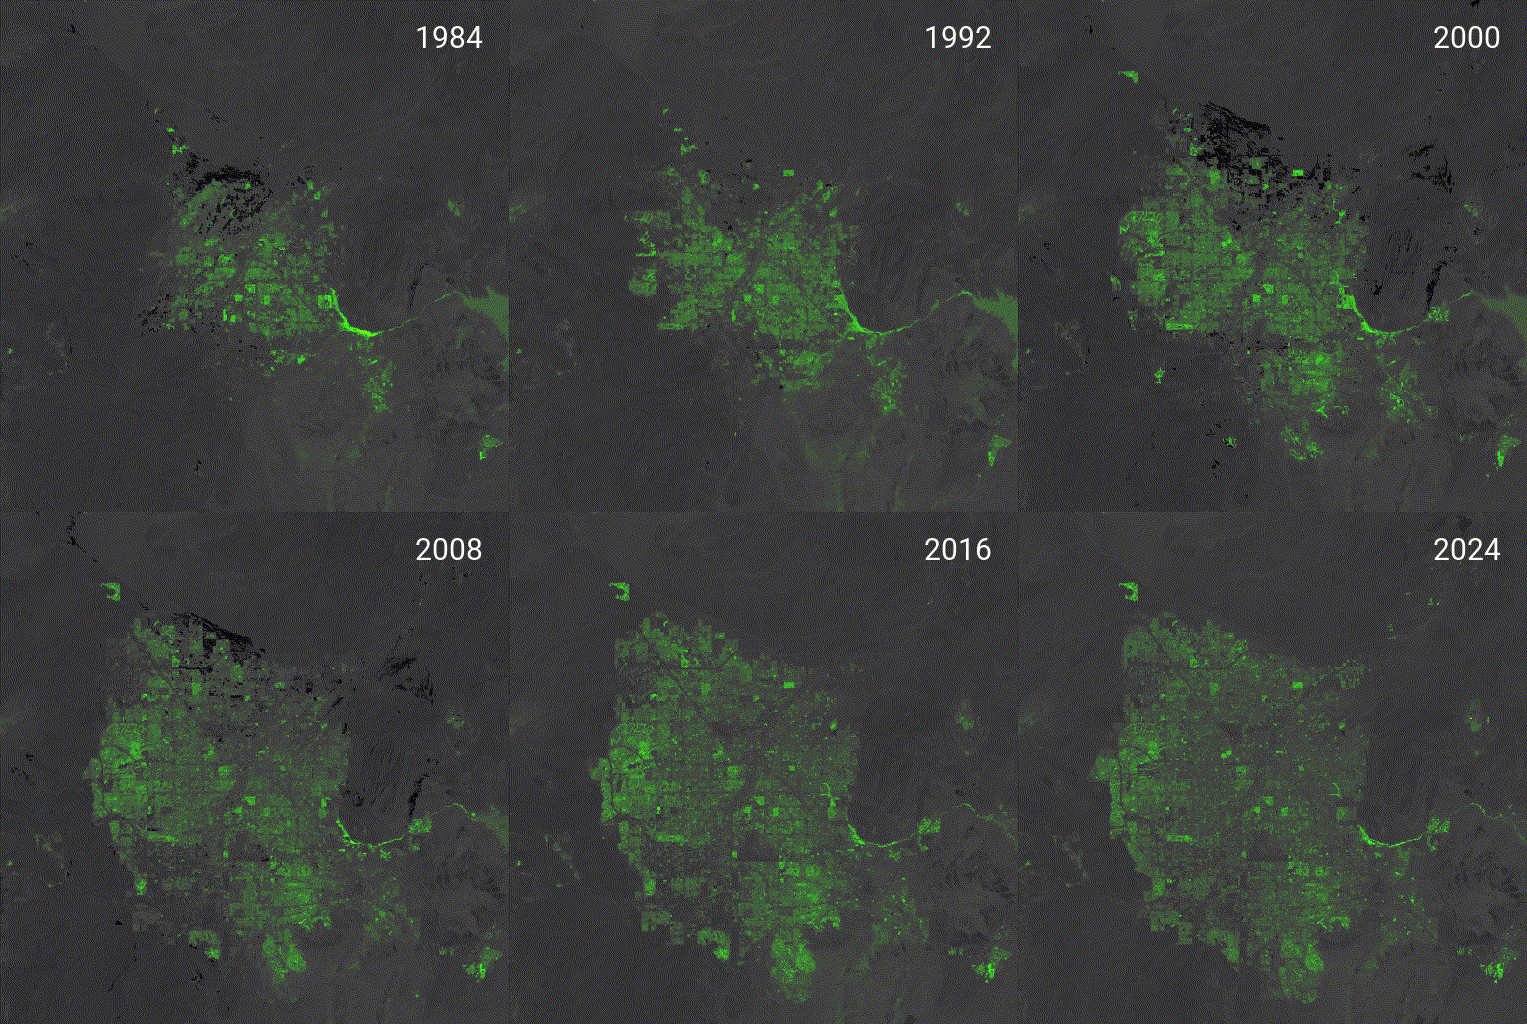
480% Growth in 40 years: A Las Vegas Growth Timelapse

Las Vegas has seen explosive population growth over the past few decades. In 1984, the metro area had a population of only ~500,000—a number that has skyrocketed to an estimated 2,900,000 as of 2024. A 480% increase, making it a good case study for exploring urban expansion using Google Earth Engine (GEE) and remote sensing techniques.
For this project, I compiled Landsat imagery from Landsat 5, 7, and 8 to create a long-term timelapse covering 1984 to 2024. My goal was to visualize the dramatic urban growth over this period. After some research, I decided to implement the Normalized Difference Built-up Index (NDBI), which highlights built-up areas by leveraging Shortwave Infrared (SWIR) and Near Infrared (NIR) bands from Landsat imagery. I also filtered for summer months to ensure clearer, more consistent images with minimal cloud cover.
NDBI = (NIR-SWIR) / (NIR+SWIR)
To bring the data to life, I used Python’s PIL library to convert the processed images into an animated timelapse. This project was a great learning experience, deepening my understanding of satellite imagery, spectral bands, and remote sensing techniques.
I’m still honing my Python skills, but this was a fun and rewarding challenge—and I’m getting better! 😉