480% Growth in 40 years: A Las Vegas Growth Timelapse Las Vegas has seen explosive population growth over the past few decades. In 1984, the metro area had a population of only ~500,000—a number...
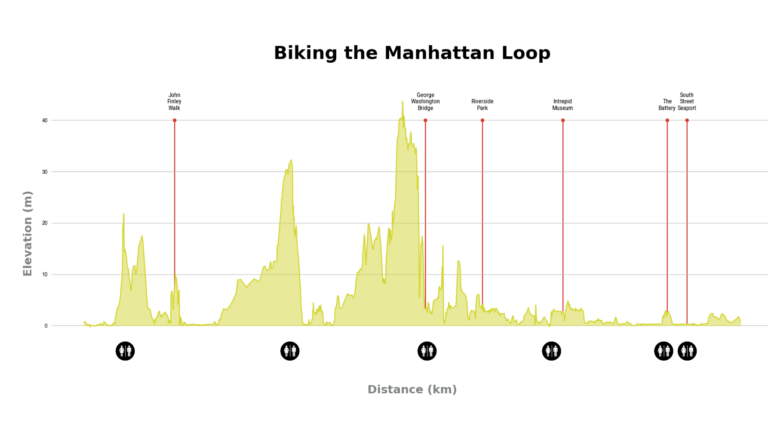
NYC Cycling Map + Graphic A Data-Driven Cycling Map As a cyclist and map enthusiast, I wanted to create a rich, interactive map of the Manhattan Waterfront Greenway, incorporating not only the bike...

Motion-Tracked Property Callout: A Real Estate Animation Project Project Overview I created an animated property callout that seamlessly tracks with drone footage to highlight a newly listed real...
I may be sitting in front of the computer during a deep winter freeze but I’m secretly dreaming of some of the places I would love to ride and bring my family someday. Many of the Colorado...

I had a lot of fun getting familiar with the Skyfield API and making a list of the cities that I’ve visited to see which one is closer to the center of the earth. It turns out that London is the...

A Model For Other Towns – Relocating Valmeyer Town To Mitigate Flood Risk Old Valmeyer Business District After the 1993 flood destroyed Valmeyer, Illinois, GIS-driven flood analysis guided the...

As part of my GIS Fundamentals course with UC Davis on Coursera we were tasked with doing an analysis and map creation showing the percentage of total land burned in each county. It was interesting to...
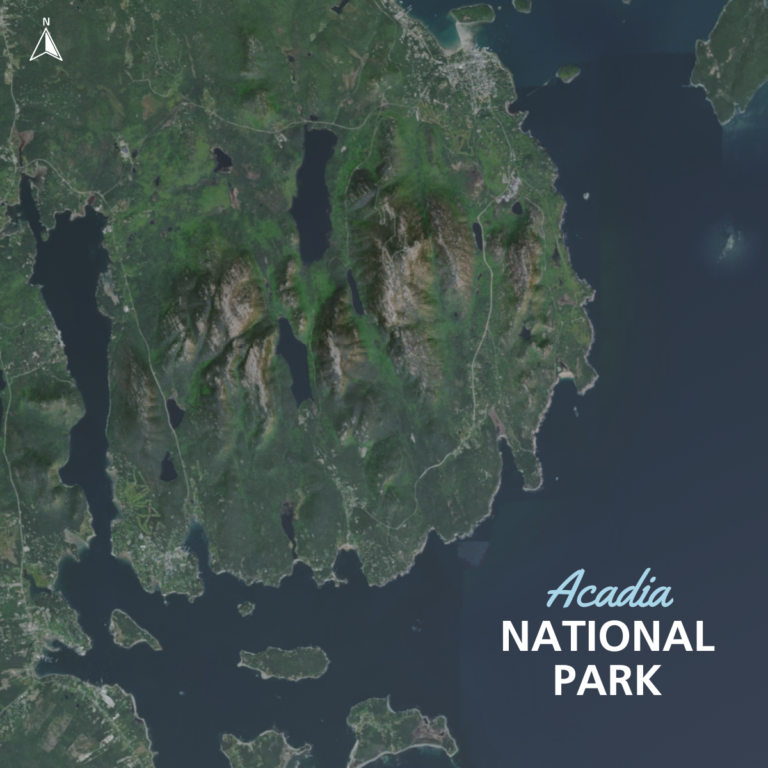
Inspired by a recent trip to Acadia camping with my family I wanted to make a elevation map that could tell a more accurate visual story about the mountains in and around the park than a standalone...